Abstract: The gap between formal and informal architecture is discussed with an emphasis on the need to leverage informal architecture artifacts for analysis. A new methodology for creating formal structured models from informal architecture artifacts is presented. The methodology is demonstrated using a sample architecture diagram and the resulting model is analyzed using graph analysis techniques.
A note about this paper: While I intended to refine this paper for peer-reviewed publication, that has not been as high a priority as I previously intended. Rather than delay any further, I felt it was better to publish as-is without peer review. After all, I am demonstrating a methodology here, not making claims about any sort of scientific conclusions.
The preprint for the version of this article submitted for peer review is available at https://www.preprints.org/manuscript/202405.0305/v1.
A peer reviewed evolution of this paper was published on 15 October 2024 at https://www.mdpi.com/2078-2489/15/10/642
TL;DR
Since I've chosen to publish this as a blog post rather than a more formal academic paper, I'll start with a TL;DR summary for those who don't want to read though all the details and background.
In short, this paper presents a method for extracting data from informal diagrams created with Draw.io. The Draw.io diagrams, which store diagram contents as XML, are ultimately converted to NetworkX graphs to be used for any variety of analysis techniques. For details on how it works, see the methodology section.
All code is made publicly available on GitHub.
Introduction
There is a large gap between the state of software engineering research and the state of practice 1 2. One such gap is the focus on formal methods in research and the use of informal methods in practice 3. A challenge of informal architectures is the inconsistency in structure, formatting, and syntax. Extracting data from informal design artifacts is important for analysis and simulation of formal architectures as it is common for formal architecture models to contain structural or syntactic inconsistencies 45. Formal models contain structure and syntax targeted at allowing the model to be understood in semantic and programmatic way 6. Structured (formal and semi-formal) models can be used for automated processes such as analyzing connectivity, relationships, impact analysis, and more 7.
Formal models, however, require architects and system designers to have deep niche knowledge about modeling languages and modeling tools 8. This unique skill set is frequently lacking in engineering organizations making the adoption of formal methods challenging due to both time and cost. As a result, informal methods such as natural-language text documents and boxes-and-lines diagrams are often used in practice rather than more formal methods 3.
Informal methods frequently consist of a combination of data types such as natural-language documents, wikis, boxes-and-lines diagrams, sketches, etc. 3. This paper focuses on one of those informal artifacts, the boxes-and-lines diagram, and explores techniques for extracting structured data from the informal artifact. The diagramming tool chosen for this analysis was Draw.io (also available online as diagrams.net) because it is user-friendly, widely used, and open source 9. Techniques will be demonstrated for extracting graph-like data structures from these diagrams and connecting those structures to other analysis tools such as Python's NetworkX library and Neo4j. Finally, a sample analysis is conducted to demonstrate the full end-to-end flow leveraging informal architecture artifacts for formal analysis.
All source code is available on GitHub at https://github.com/josh-kaplan/data-from-diagrams.
Background
Architecture Diagrams
What constitutes an architecture diagram does not always have a clear definition 10. Architecture generally shows many views of a system. Diagrams are used in software architecture to communicate various aspects of the system using different viewpoints to represent different perspectives. This section will describe some of those views with simplified visual examples to demonstrate the variety of architecture views and their purpose.
Behavioral (Activity) Diagrams
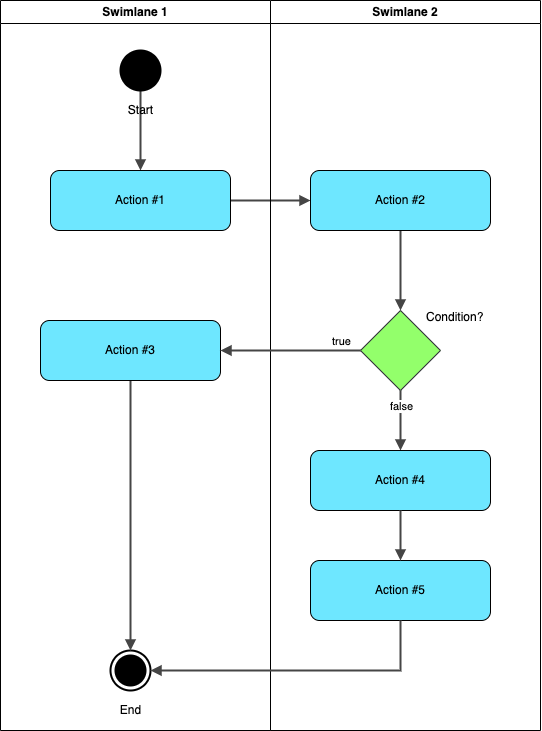
UML (Unified Modeling Language) is a visual language used for modeling software systems 6. SysML is a similar language used for describing complex systems 7. One type of diagram used in UML is the activity diagram, which is used to describe the behavior of a piece of system functionality 67.
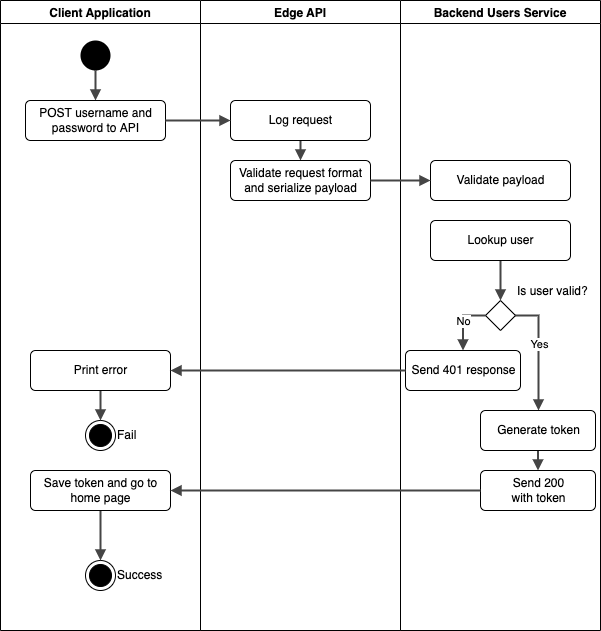
This diagram shows an example of a login action for a software application. It separates action responsibilities among client, edge API, and backend service components to show which system components perform which actions. It also shows a logical condition in the behavior.
Network Diagrams
Network diagrams typically show the logical and sometimes physical segmentation of a network. The example below is based on one of the available Draw.io network diagram templates.
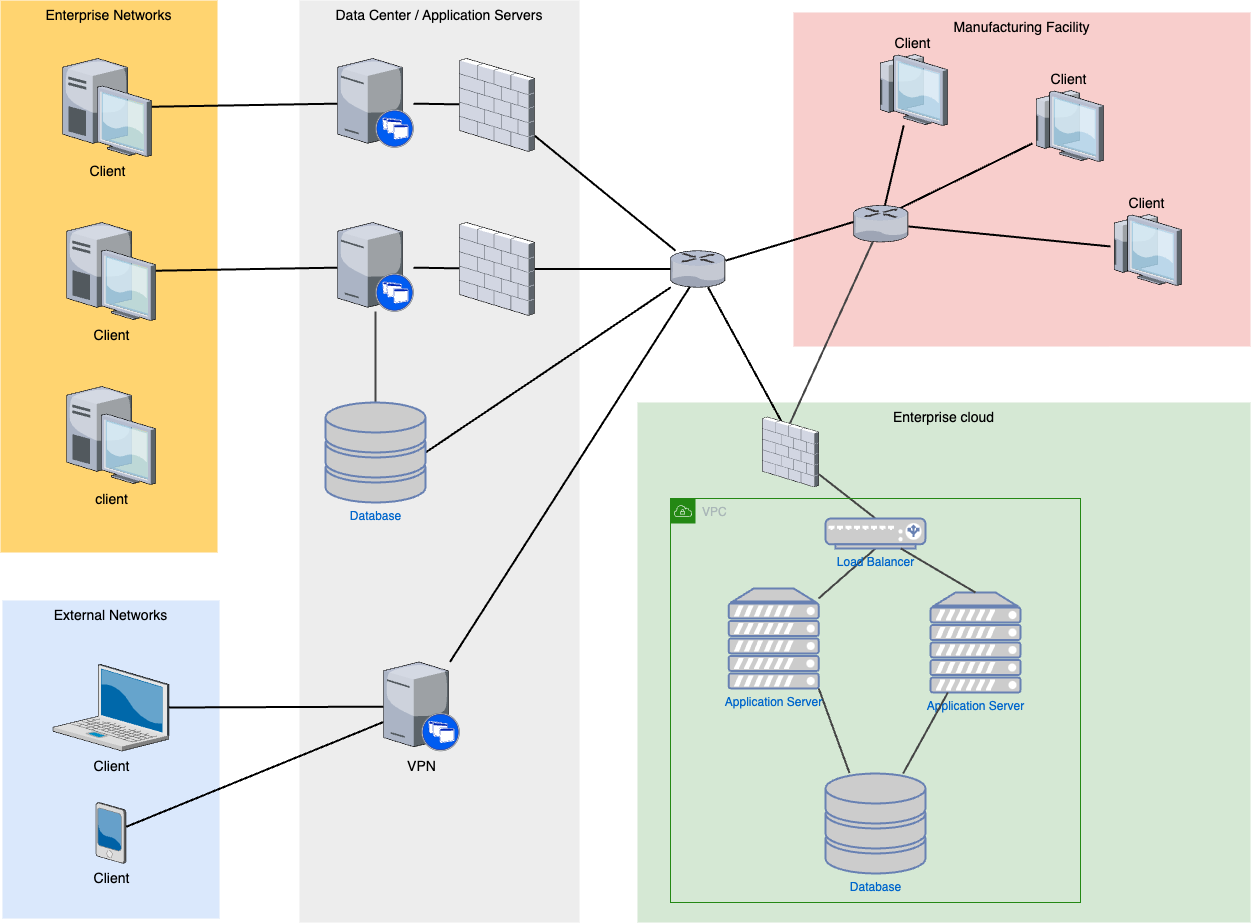
In this network diagram, several different types of computing assets are shown connected via networking devices. Assets are visually grouped into logical network enclaves.
A cloud architecture diagram is a variation on a network diagram. Cloud architectecture diagrams are frequently used to communicate the cloud computing services used in a system and the connections between those services.
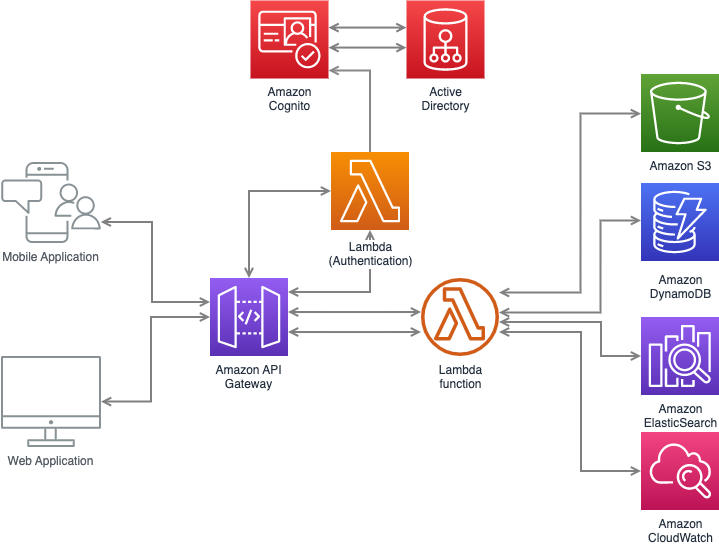
Similar to a network diagram, a cloud architecture tends to show logical network connections. However a cloud architecture diagram tends to focus more on logical data flow and specific use of cloud technologies.
Structural Diagrams
An Entity Relationship Diagram (ERD) is used to communicate the structure and relationships between data tables 6.
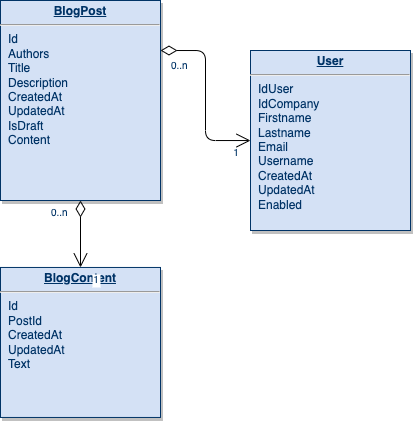
There are different syntaxes to this style of diagram depending on the language (e.g. UML, SysML, etc.) but the general purpose is the same 67. This type of diagram shows the objects or data entities that exist in a system. This can be used to represent database tabes or class relationships. Similar diagrams can be used in cyber-physical domains using SysML to show the logical structure of a system 7.
Other Diagram Types
There are many other types of diagrams used in software and systems engineering. These sometimes overlap in purpose or syntax and lack consistency in notation. The examples above are used as an illustrative example of the variety of these diagram types in both syntax and purpose.
Other diagram that could be considered are 67:
- Sequence Diagrams
- Use Case Diagrams
- Deployment Diagrams
- Component Diagrams
- State Machine Diagrams
- Class Diagrams
- Package Diagrams
It should be noted that the methodolody presented in this paper is intended as a general solution to data extraction and modeling rather than a solution to a single diagram type.
Tooling
Draw.io (Diagrams.net) and MxGraph
There are a number of different tools available for creating diagrams. One of these is Diagrams.net (formerly Draw.io) which is a web-based diagramming tool that can be used to generate a variety of general purpose diagrams 11. In addition to the web-based version of the tool, there is also a desktop version (branded as Draw.io Desktop) 12 and a Visual Studio Code (VSCode) extension 1314, which is an unofficial version of the tool that allows software developers to edit diagrams directly in Visual Studio Code.
The .drawio format is a readily parsable XML file based on MxGraph,
and XML format for storing graph data structures 15.
Other formats were explored so that the diagrams could be readily embedded in
Markdown files. Importantly the files need to be parsable in a way that data
can still be extracted out of the diagram.
Draw.io VSCode Integration
One method explored for diagraming is to use the Draw.io VSCode extension by
Henning Dietrichs 13.
This extension embeds the Draw.io application into VSCode so that files with
extensions *.drawio, *.drawio.svg or *.drawio.png will be opened in a
Draw.io tab rather than an ASCII text file.
Other Tool Considerations & Tool Selection
Other tools were considered for this method were Microsoft Visio, Lucidchart, and Gliffy. Draw.io was selected for its accessibility and open source nature.
Both the desktop tool and the VSCode extension were used to generate diagrams. Draw.io was chosen for this analysis due to its widespread use, general purpose use case, and because it is open source.
Methodology Overview
This section outlines the general method for creating structured models from informal Draw.io
diagrams. The .drawio.png file format will be the primary focus, for its
practical use in documentation 16.
1. Begin with a Draw.io diagram, saved as a .drawio.png file.
Those wishing to reproduce this method may use the image below as it is using
this format. In this case, a simple activity diagram is used.
2. Extract the MxFile data from the image. The MxFile XML is stored as metadata in the image. This can be extracted and converted into a usable format.
3. Convert to JSON (optional). As an intermediate step, the method used in this paper converts the MxFile XML to JSON. This is done primarily for the convencience of working with JSON over XML can can be skipped if needed.
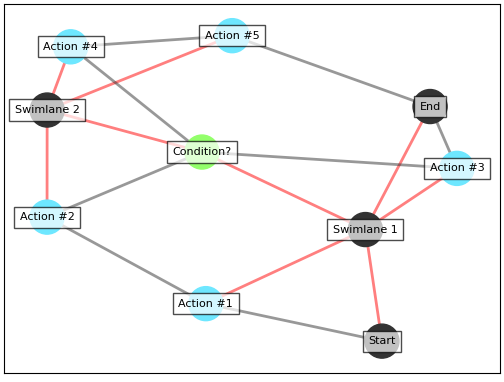
4. Convert to NetworkX. Next, data is converted into a usable model. The primary method used for demonstration is Draw.io but there are no technical limitations to the format at this point. With a NetworkX model, a usable format is available for analysis or visualization.
5. Infer Additional Information (optional). A final step is to infer additional information that might be useful in a model that was not present in the original diagram. This is discussed in detail later in this paper.
The remaining sections of this paper will cover each of these stages in detail. First data extraction and format conversion is discussed, then inferences. Finally, an end-to-end example is shown which demonstrates indexing, query, and analysis concepts.
Methodology Detailed
File Formats
In an effort to breakdown each file format, a simple "Hello, World" diagram is used as an illustrative example. This sample diagram contains two nodes labeled "Hello" and "World", shown below.

The "Hello" node has a data property called name with a value of foo. While
this is ultimately a simple example, it will used to show the contents of each
file type in detail.
The .drawio File Format
Draw.io uses the MxGraph library
for storing graph data15. The full format is show in Appendix B.
MxGraph stores data in MxFiles these files are XML documents as show in the
hello.drawio XML code snippet below.
...
This is the format of .drawio files.
The .drawio.svg File Format
The .drawio.svg format encodes the diagram as an SVG file, which is
an XML document that describes the geometry and style of an image. The mxfile
is stored as a string in the content attribute on the top-level SVG tag, this
data for the Hello World example is shown below: 17
Note that newlines have been added for formatting purposes. Attempts to reproduce data extraction without removing added newlines and indentation may fail.
<mxfile><diagram id="qbnI3
Jh8MCjU6w0Z3omK"name="Page-1">
vVRNc4IwEP01XDuBVMdz1dZLTx5sj5GsQCewTAgC/fUNZsNHr
Z324kXz3m52sy8vBHydty9alOkrSlBBxGQb8E0QRcvVo/3tic
4RfBE6ItGZdNSE2GefQCQjts4kVLNEg6hMVs7JGIsCYjPjhNb
YzNNOqOZdS5HAFbGPhbpmD5k0qWNXCzbyO8iS1HcOGUVy4ZOJ
qFIhsZlQfBvwtUY0bpW3a1C9dl4Xt+/5RnQ4mIbC/GUDXURlO
j8bSDsqwQIL+/eUmlxZFNqlLau7NwuYB+89eFh4uGmnwU1HyL
Xpa988KFEV1jqmrIjuVugEKIsPIllzAeZgu9gUDUqY7DyvLui
akyFvVMIuSIwLxONHb5SIKXEE5bbtbBRdpULkVPqERHkFo8mB
SNyJmhrrQoIkFZo0M7AvxWW+xj6Nubiu8Bm0gfZ3ma4FaAeru
S30skLvyWb0aejNl048umT/1sxCku1nb3GaR6ia1Digti/tu+
PurRFnd9VofMyX2OSLyLdf
</diagram></mxfile>
The data value in the content attribute contains escaped HTML. Unescaping the
HTML gives an MxFile, however the data is still encoded. The data is URL encoded,
then deflated and base-64 encoded. Reversing this encoding, give the MxGraph XML
as shown in Snippet 2.
The tool CyberChef 18 was used to represent the complete extraction method in a platform agnostic way. The CyberChef recipe for converting the original SVG file to the MxGraph XML data is:
Find_/
Find_/
The .drawio.png File Format
This was a bit simpler and also seems to lend itself better to document generation. The PNG is URL encoded, so a simple URL decode returns the mxfile XML data in the PNG which can then be extracted using a simple RegEx.
The cyberchef recipe to extract the mxFile is this:
Draw.io PNGs
Extracting the MxFile
The following function takes as input a file path (called fpath) pointing to
a .drawio.png file and returns the MxFile XML as a string.
return None
=
=
=
=
=
return
Converting to JSON
The Python code to convert this into JSON is as follows:
=
:
=
=
=
return
This uses a custom MxGraph class which contains the logic for parsing the
MxGraph intro a flattened list of dictionaries.
Creating NetworkX Models
To conver the MxFile contents to a more usable format, NetworkX is used. NetworkX provides functionality for working with graph data structures such as traversal and analysis. It also provides visualization capabilities.
The following Python code demonstrates how to convert the MxFile contents to NetworkX. In short, all diagram elements are traversed and identified as either a node or an edge. The the appropriate NetworkX functions are used to add the elements to a NetworkX graph.
=
=
=
# Loop over all diagram elements
# Get the element ID
=
# If the element is a vertex
# If the element is an edge
== :
=
=
# Add the nodes
# Add the edges
Note that the above code snippet is a simplification of the actual code to illustrate the methodology. The algorithm used in practice captures node label information, style, and coloring. The complete code is available online.
Inferring Information
After extracting data from the diagram and converting to a NetworkX graph, the graph can be analyzed to infer information not contained in the diagram data. This sections discusses several of these concepts with examples.
Geometric Inferences
Consider the previous network or behavior diagrams. In each of these diagrams there are geometric relationships (i.e. one diagram element is inside another). This is shown as network enclaves or subnets in the network diagram, or swimlanes in the activity diagram.
If there are no explicit relationships between the diagram elements inside a container and the container itself, it is possible to identify and create those with simple geometric filtering using the following pseudocode:
# The bounds of element i
=
=
# The bounds of element j
=
=
# True if element j's x bounds are inside element i's x bounds
=
# True if element j's y bounds are inside element i's y bounds
=
# If element j's X and Y bounds are inside element i's bounds,
# create a relationship identifying element j is inside i
In this example, the graph is analyzed for nodes that are inside other nodes.
By comparing each node to each other node19, elements whose bounds lie
entirely within the bounds of another element are identified. If this condition
is true, an in relationship is added between those two elements.
While this may be an inefficient approach to this problem at scale, diagrams are designed to be visual and therefore should not reach a scale where this becomes a computationally hard problem.
Parent-Child Relationships
A similar approach can be applied to identifying parent-child relationships in the
diagram. This is applicable when there is a hierarchical link between two elements
rather than a relationship link. For example, in MxGraph certain elements can be
nested inside other elements differently from the geometric approach above.
MxGraph uses a parent attribute on a graph element to indicate this. This often
applies to swimlanes or other grouping elements.
To capture these relationships, the following Python code is used:
In this case, a complementary bi-directional relationship is created between the two elements.
Other Inferences
- Traversing intermediate connections. Another example is traversing intermediate connections. This could address the need to understand the relationships in a diagram while traversing the graph (e.g. element A is linked to B is linked to C). It will be shown later in this paper that by leveraging modern graph databases, this sort of pattern can be identified without the need for making the inference manually.
- Grouping by proximity. Grouping related elements together based on proximity, within some specified tolerance, has alsso been suggested.
- Element type identification. Identifying different types of diagram elements can also be useful. This can be done either by adding data fields to elements or considering element style.
- Edge types / edge labels. The demonstrated approach ignores edge labels in MxGraph due to the added complexity and distraction for the core method being presented. In MxGraph, edge labels are vertices making their role in the graph more complex. In future work, it is recommended that this be reconciled and edge labels are captured as edge metadata and used as either a visual label and/or an edge type identifier.
An End-to-End Example
In this section, an end-to-end example is given that begins with an architecture diagram and uses the data extraction methods presented to generate models that can be queried. Analysis techniques are demonstrated to answer representative real-world questions and provide insight about a system.
Creating the Model
The following network diagram is a simplified representation of a network that might be used in a small business. It contains four key network enclaves: enterprise offices, a manufacturing facility, an on-premises data center, and a cloud-based back-office system.
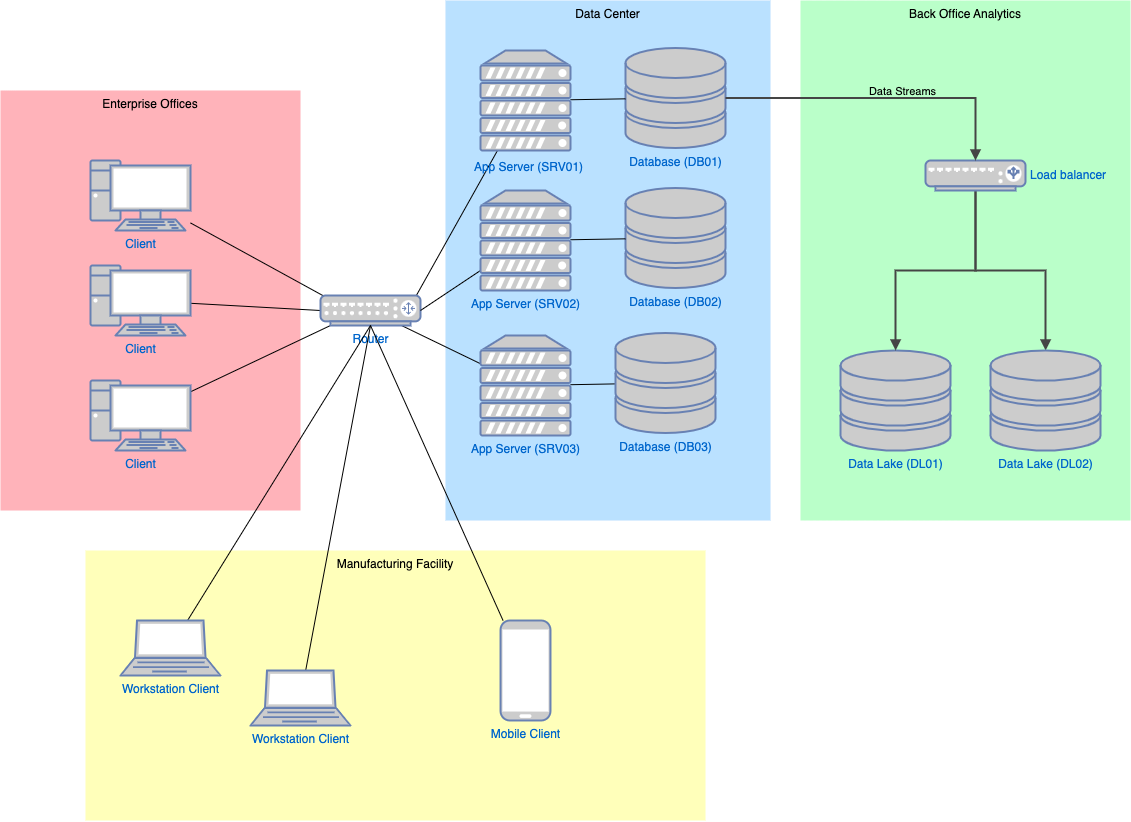
This example will be used to demonstrate how one might analyze a network to understand interactions between systems, analyze impacts, or assess risk. Next, the diagram is converted to a NetworkX graph and additional information is inferred as described in the previous sections.
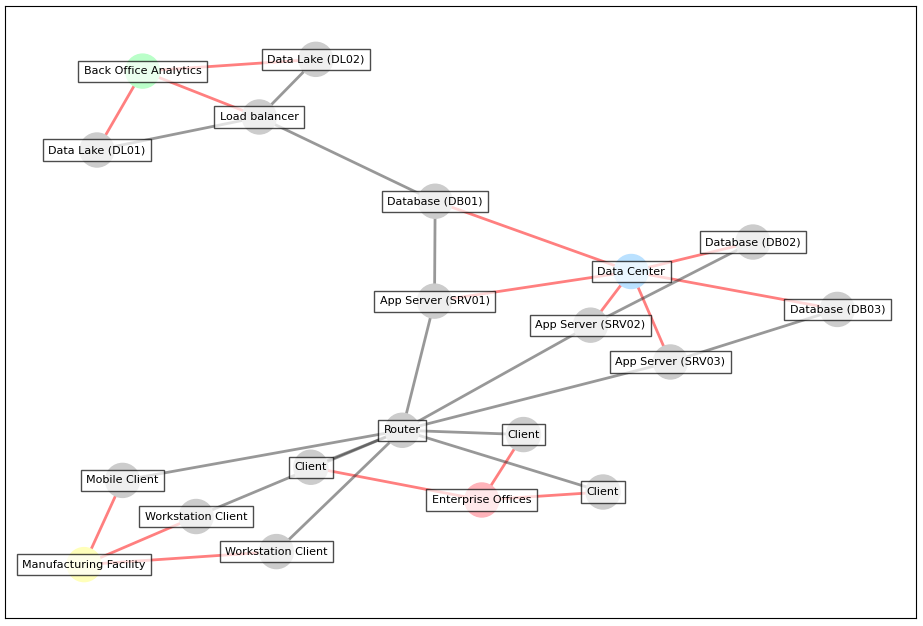
The edges colored red are the inferred relationships that capture the geometric containment ("in" relationships") of diagram elements inside the network enclaves. In the following sections this information is used to show how to query the model.
Indexing with Graph Databases
Indexing the graph using a Graph database allows for more complex queries to be performed using the Cypher query language. The image below shows a simple representation of the graph in Neo4j.
Graph databases are optimized for indexing and querying graphs 20. For this paper, Neo4j Community Edition was chosed because it is widely accessible and easy to set up. The Cypher query language was found to be intuitive and well-suited to the types of analyses intended for this example.
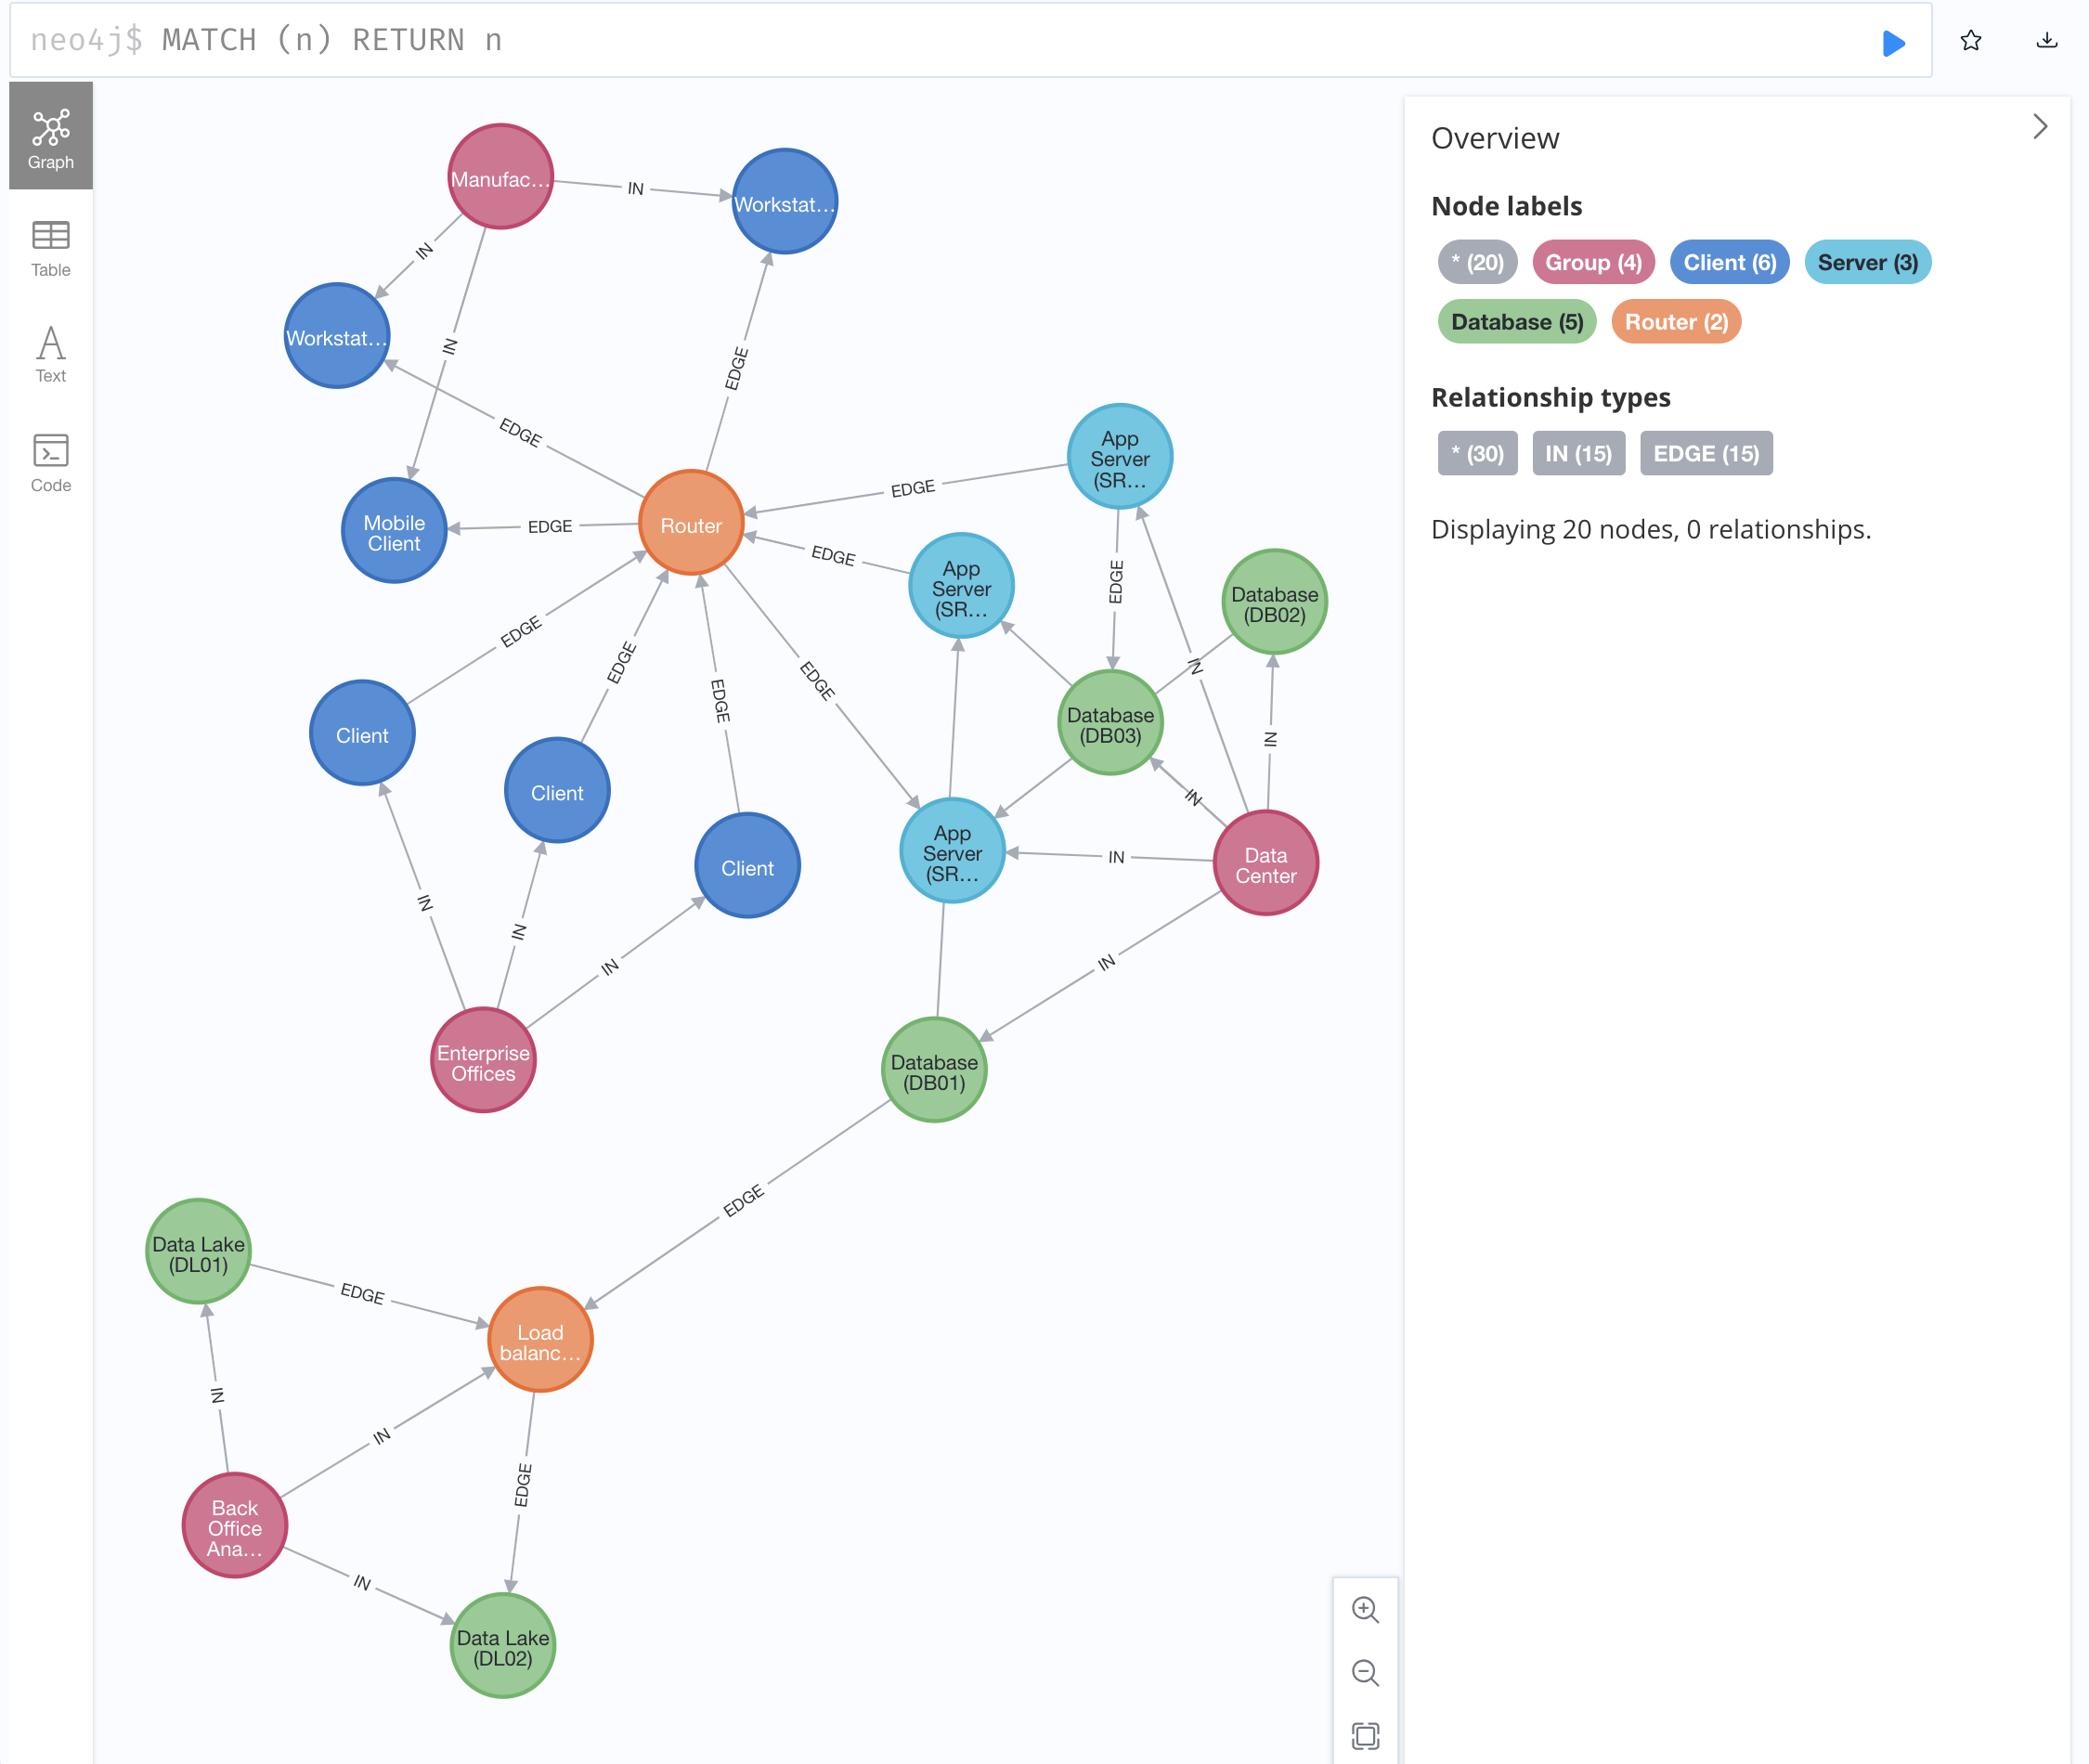
In this case, a simple match query (e.g. MATCH (n) RETURN n) is used to return
all elements in the graph. In the following section, more
complex queries are explored that leverage Cypher's pattern-matching capability
to answer questions about the system.
Querying with Cypher
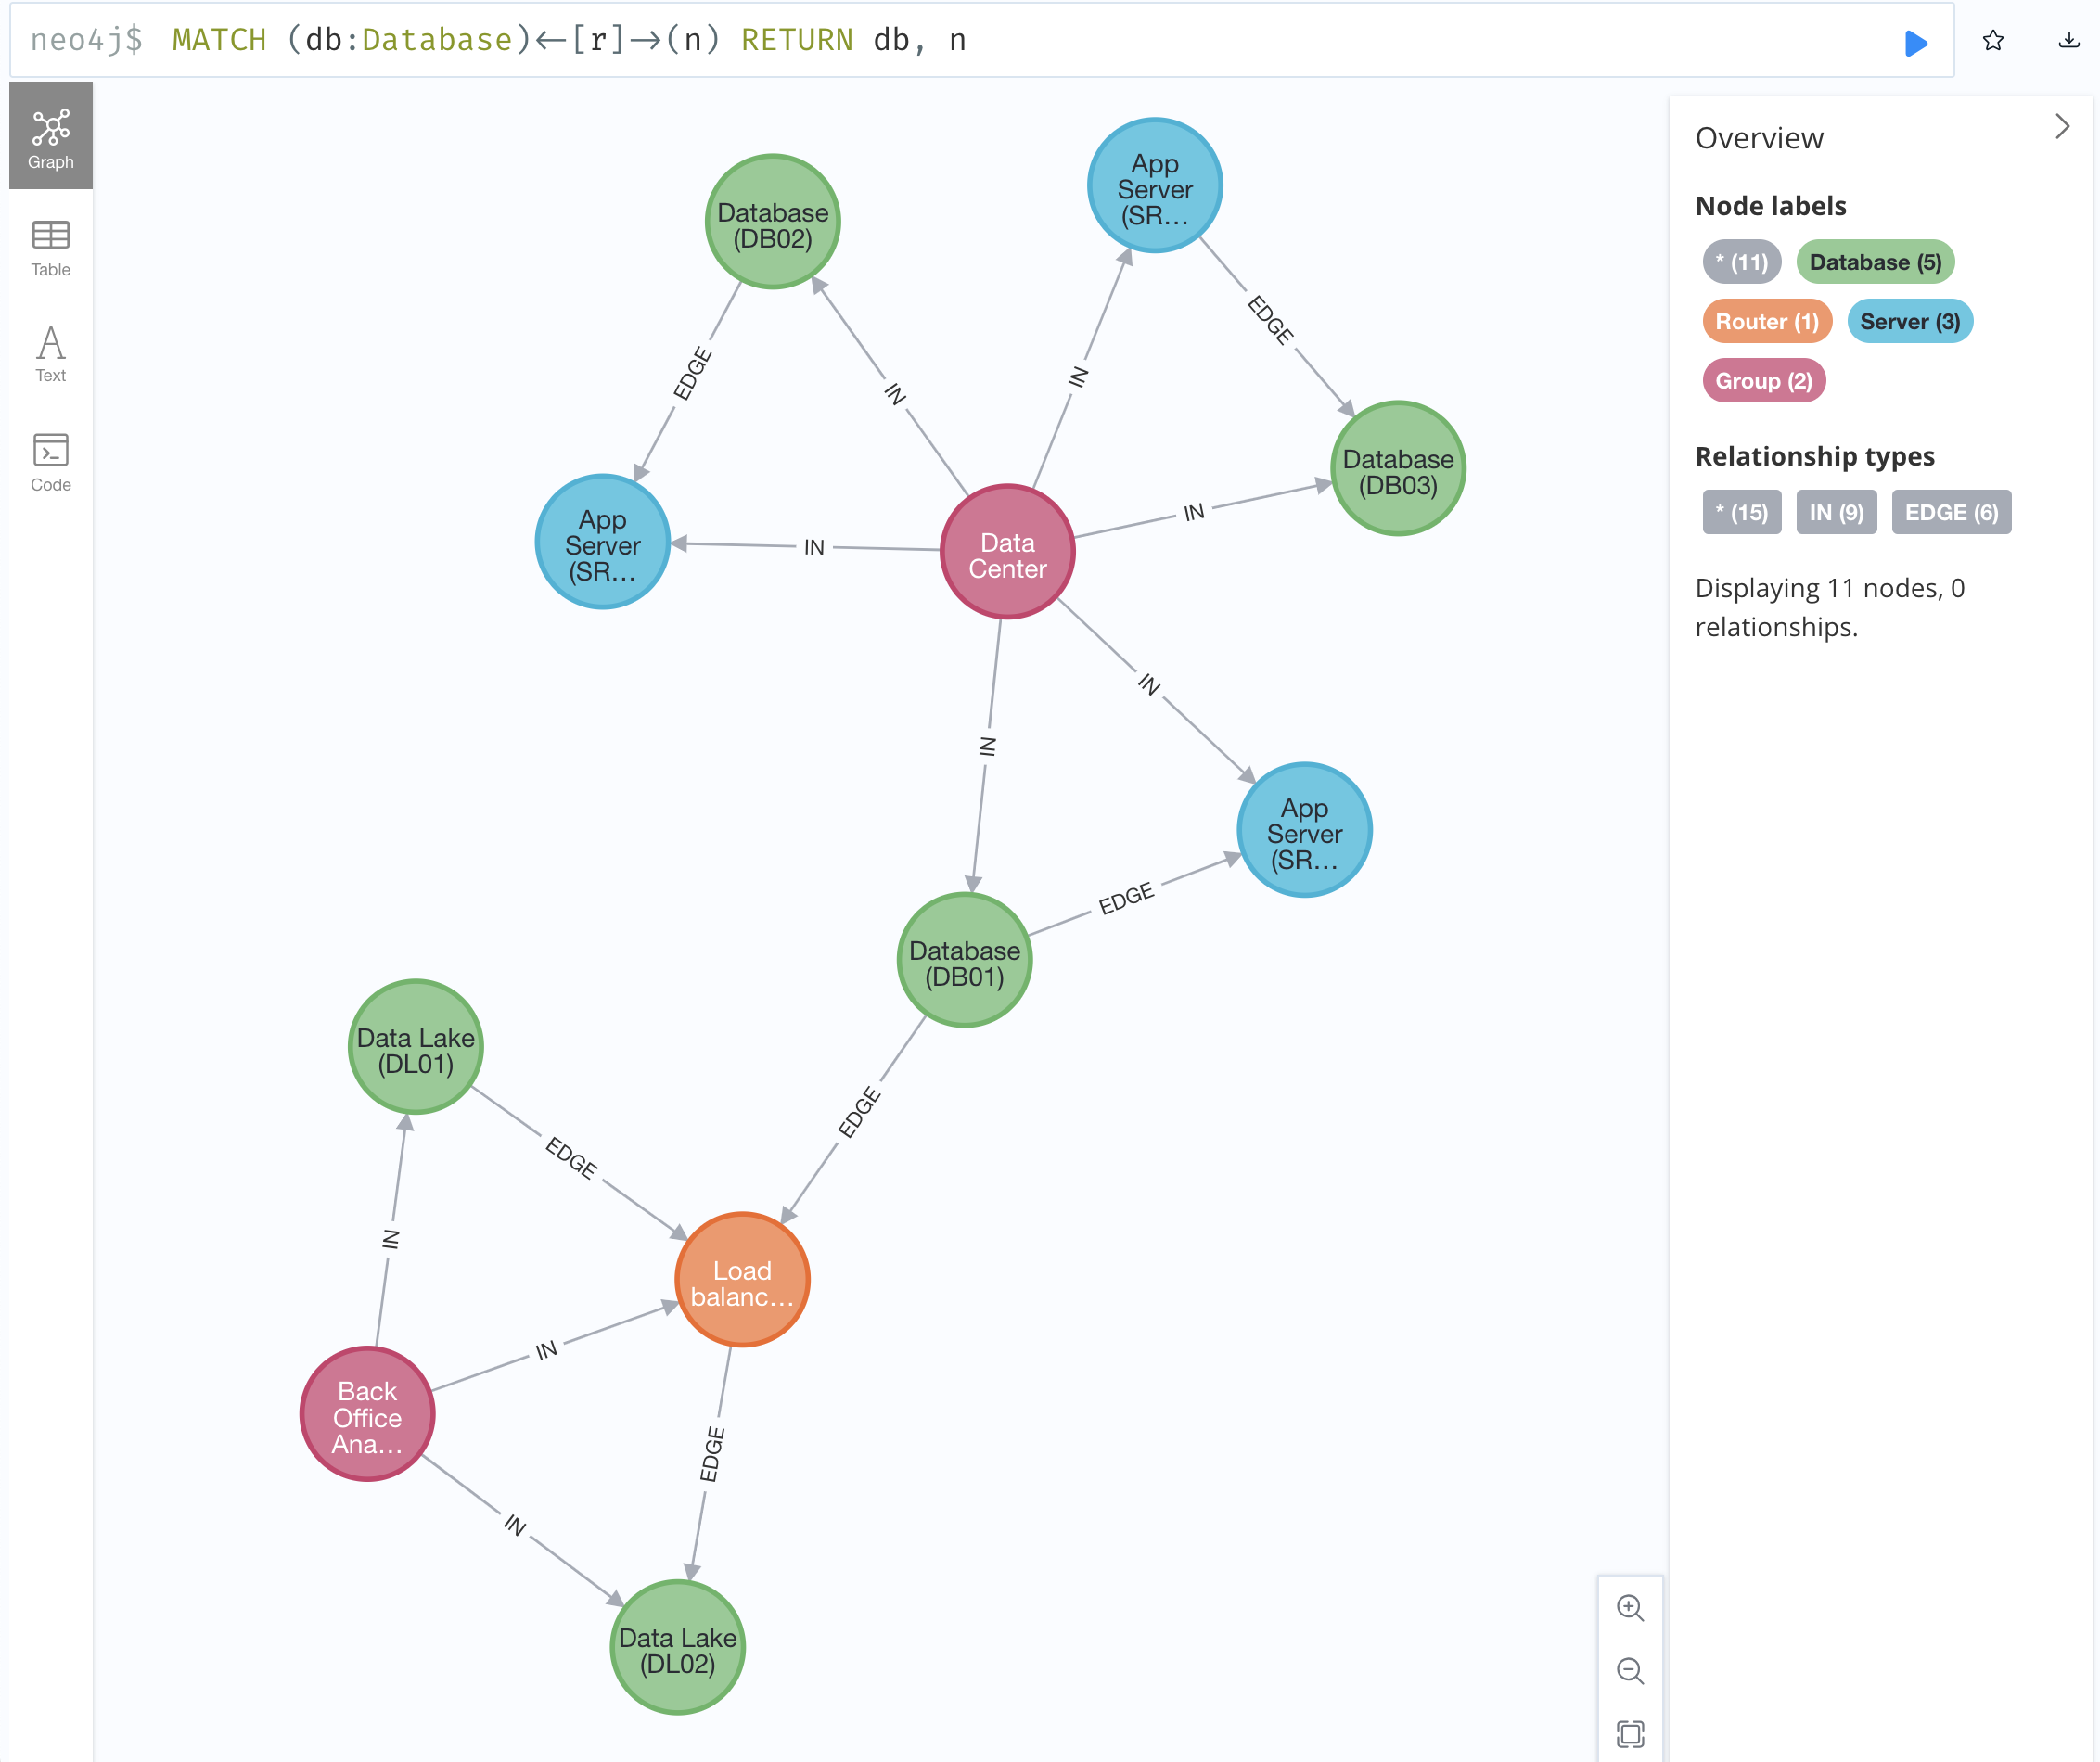
The following query demonstrates how to query the model for all databases and nodes they are connected to.
MATCH (db:Database)<-[r]->(n) RETURN db, n
This query returns all nodes of type Database (e.g. (db:Database)) and all
nodes they connect to (e.g. (n)) with no regard for the relationship direction
(e.g. <-[r]->). This yields the following results.
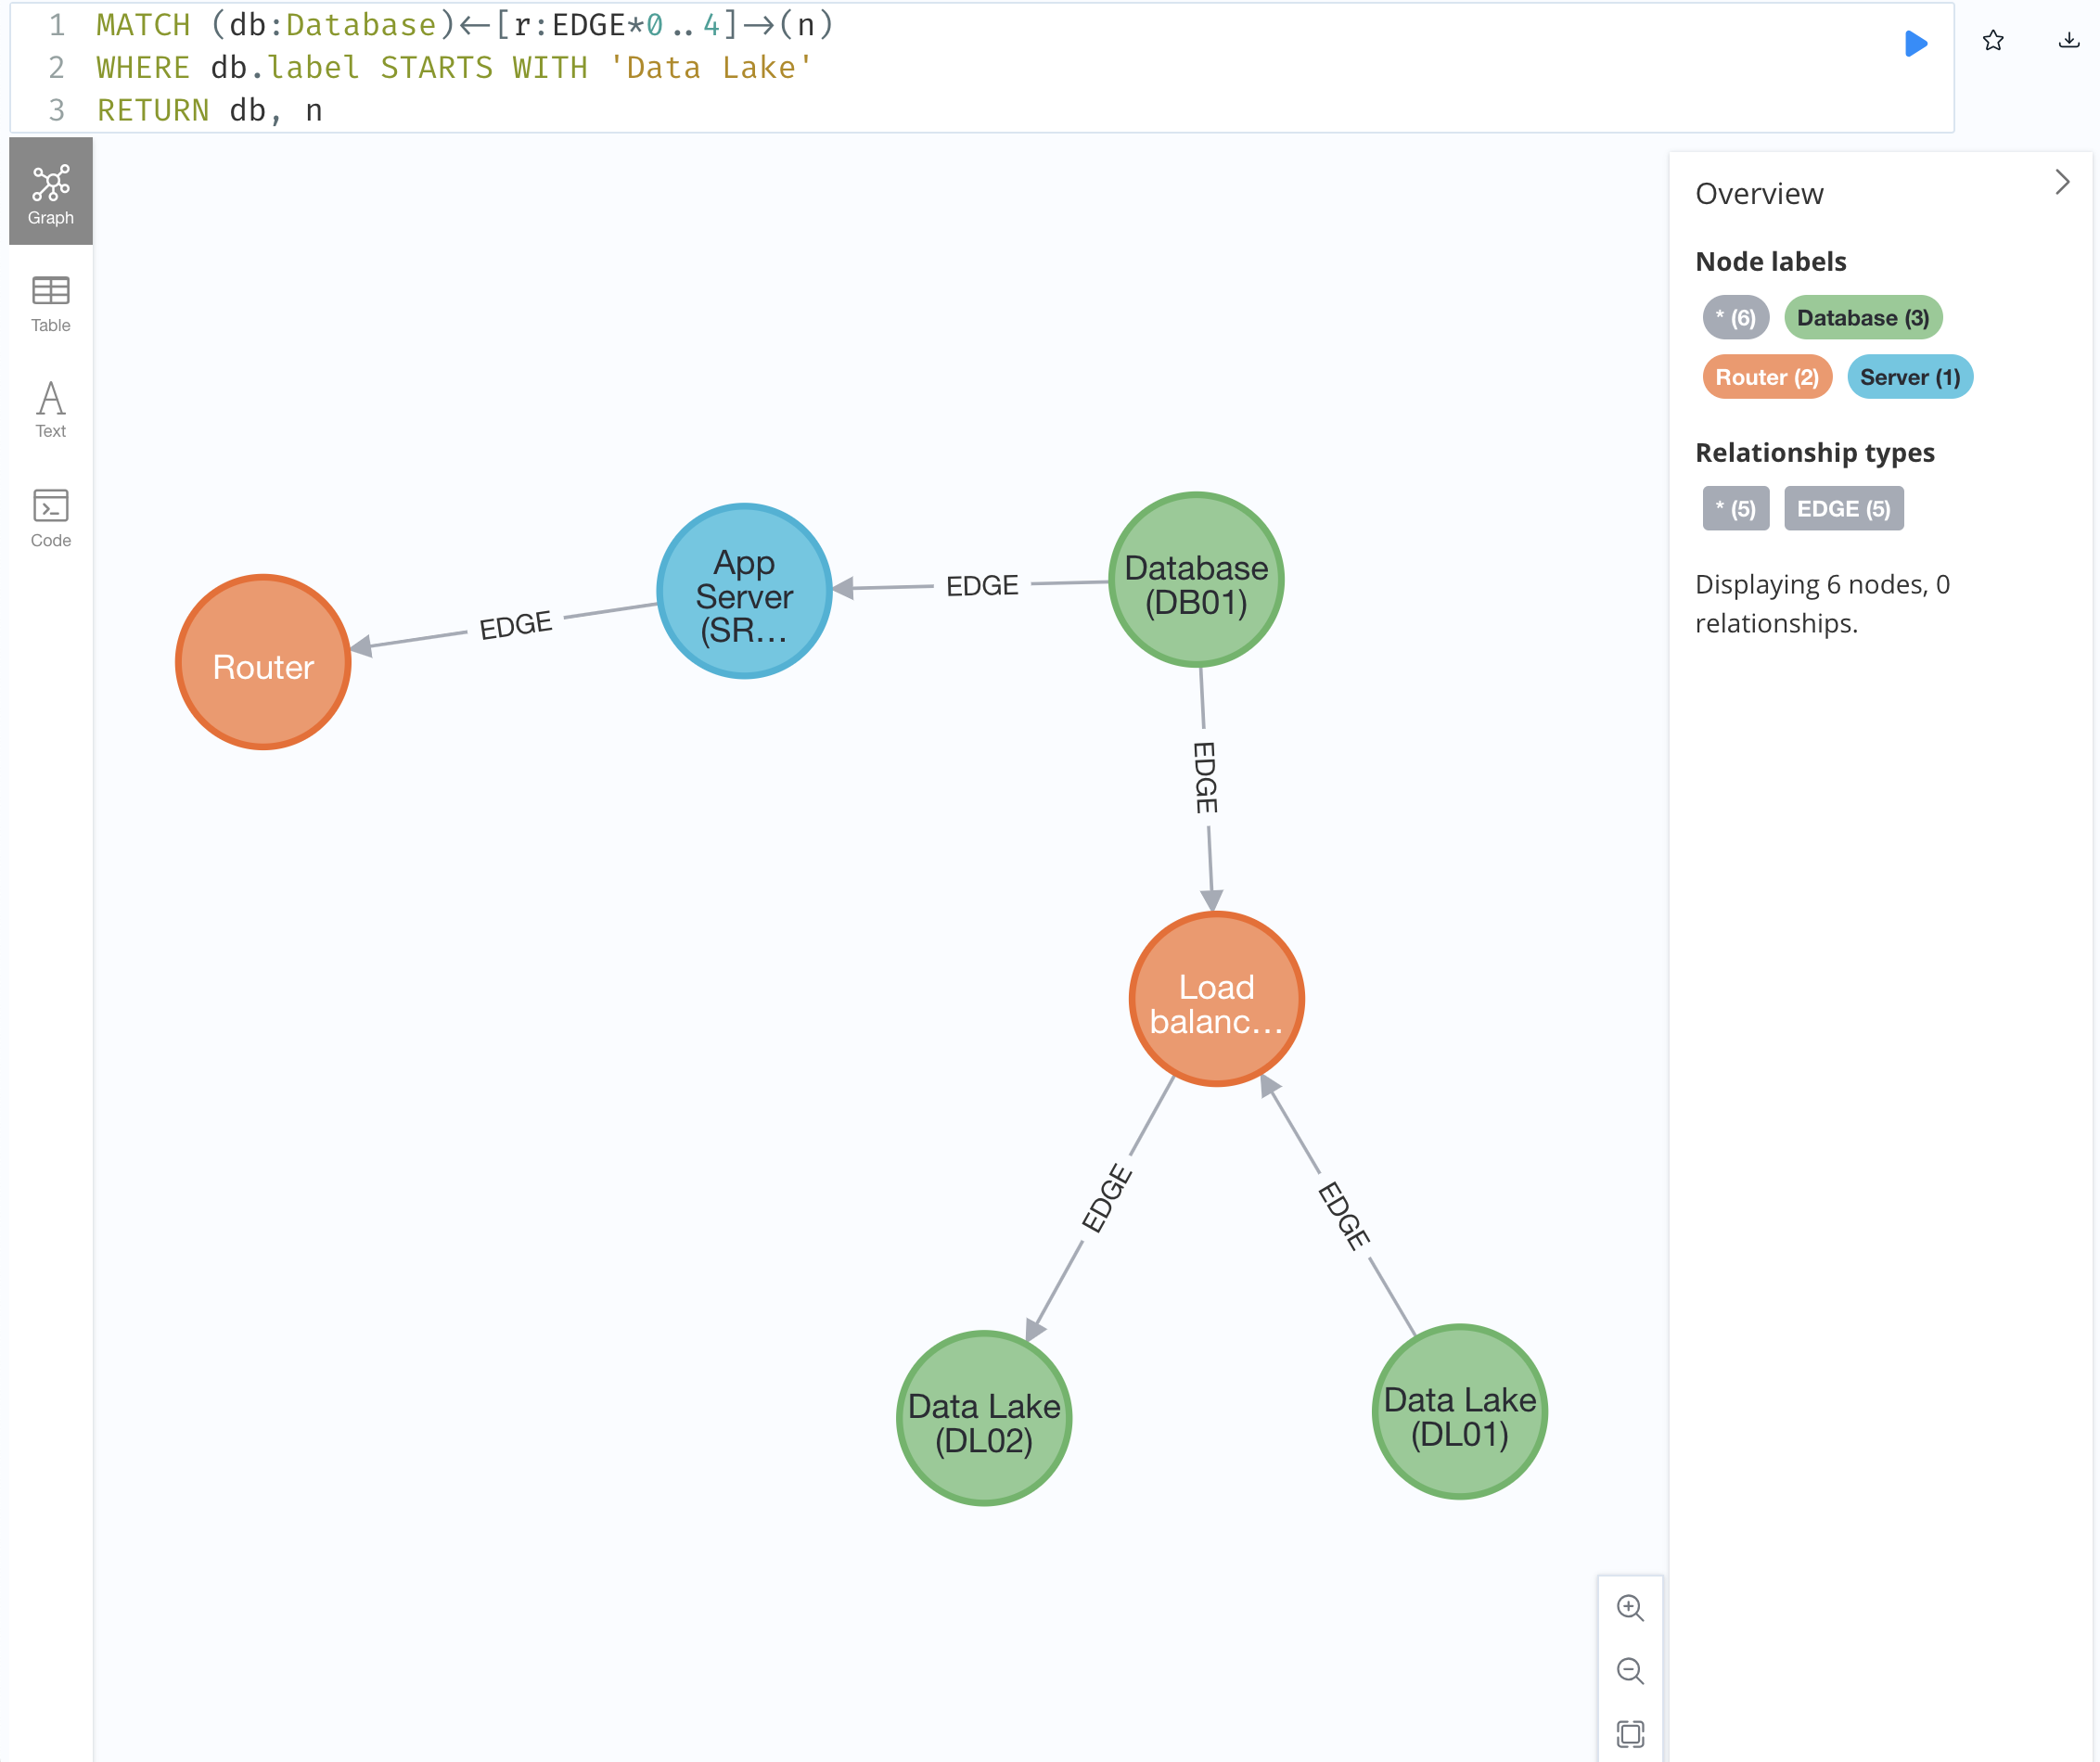
Consider a more practical scenario where an enterprise has identified a critical or sensitive asset. The graph model can be used to identify high-risk components in the architecture (e.g nodes that connect to that asset directly or indirectly). The Cypher query below demonstrates how to do this.
MATCH (db:Database)<-[r:EDGE*0..4]->(n)
WHERE db.label STARTS WITH 'Data Lake'
RETURN db, n
In this case, a similar MATCH pattern is used, with one notable exception:
the relationship is specified as a variable-length path (e.g. r:EDGE*0..4) and
only includes the EDGE type (ignoring the inferred IN relationships shown
in previous sections). The query then applies a WHERE condition to limit the
database match to only the high-value asset.
Conclusions & Future Work
A general method for creating models from informal architecture diagrams generated with Draw.io was presented. The method was shown to be effective for creating models that can be queried to analyze characteristics of a system.
It is important to note that trends in modeling are moving towards more text-based code-like formats as demonstrated with the initial release of SysML 2.0 21. This is designed to make MBSE models more semantic and executable, but also allows them to follow process more reminiscent of software engineering.
While this paper has demonstrated that the problem is feasible, much work still remains in this area. First, we see a need to explore the feasibility of this approach with other tools. While Draw.io is a popular tool, it is not the only tool used to create informal diagrams.
Second, intelligent inferences about the diagram should be further explored. Further intelligence can make this a far more practical technique for analysis. One such approach beyond the inferences presented in this paper is to consider applying this technique at scale with many diagrams describing a system and exploring the ability to link common elements across diagrams.
Finally, a path towards industry adoption remains obscured without easy to use, robust software tooling. The author views this as critical step towards adoption of this technique in practice rather than a research novelty.
All source code is available on GitHub at https://github.com/josh-kaplan/data-from-diagrams.
Acknowledgements: I would like to thank Dr. Luis Rabelo for his many discussions on this topic and review of early drafts of this paper as well as the many friends and colleagues who engaged in discussions about this topic.
References
V. Basili, L. Briand, D. Bianculli, S. Nejati, F. Pastore, M. Sabetzadeh, "Software engineering research and industry: A symbiotic relationship to foster impact", IEEE Softw. (USA), http://dx.doi.org/10.1109/MS.2018.290110216.
M. Richards, N. Ford, "Fundamentals of Software Architecture", O'Reilly Media, Inc., 2020, https://learning.oreilly.com/library/view/fundamentals-of-software/9781492043447/.
M. Ozkaya, "Do the informal & formal software modeling notations satisfy practitioners for software architecture modeling?", Information and Software Technology, 2018, doi: https://doi.org/10.1016/j.infsof.2017.10.008.
J. Keim, Y. Schneider, A. Koziolek, "Towards consistency analysis between formal and informal software architecture artefacts", Proceedings of the 2nd international workshop on establishing a community-wide infrastructure for architecture-based software engineering, 2019, doi: 10.1109/ECASE.2019.00010.
N. Ali, S. Baker, R. O’Crowley, S. Herold, J. Buckley, "Architecture consistency: State of the practice, challenges and requirements", Empir. Softw. Eng. (Germany), http://dx.doi.org/10.1007/s10664-017-9515-3.
Object Management Group, "OMG® Unified Modeling Language® (OMG UML®), Version 2.5.1", 2023, https://www.omg.org/spec/UML/2.5.1/PDF.
Object Management Group, "OMG Systems Modeling Language™ (SysML®), Version 1.6", 2023, https://www.omg.org/spec/SysML/1.6.
E. R. Carroll, R. J. Malins, "Systematic Literature Review: How is Model-Based Systems Engineering Justified?", Sandia National Laboratories, 2016, https://www.incose.org/docs/default-source/enchantment/161109-carrolled-howismodel-basedsystemsengineeringjustified-researchreport.pdf?sfvrsn=2&sfvrsn=2.
JGraph Ltd., "Github - jgraph/drawio (Source Code)", July 2023, https://github.com/jgraph/drawio.
M. Fowler, "Software Architecture Guide", https://martinfowler.com/architecture/.
JGraph Ltd., "draw.io", July 2023, https://www.drawio.com/.
JGraph Ltd., "Github - jgraph/drawio-desktop (Source Code)", July 2023, https://github.com/jgraph/drawio-desktop.
Henning Dieterichs, "Github - hediet/vscode-drawio (Source Code)", July 2023, https://github.com/hediet/vscode-drawio.
Henning Dieterichs, "Draw.io Integration - Visual Studio Marketplace", July 2023, https://marketplace.visualstudio.com/items?itemName=hediet.vscode-drawio.
JGraph Ltd, "MxGraph", https://jgraph.github.io/mxgraph/.
J. Kaplan, "Agile Architecture in Practice", 2023, https://jdkaplan.com/articles/agile-architecture-in-practice.
GCHQ, "CyberChef", https://gchq.github.io/CyberChef/.
I. Robinson, J. Webber, E. Eifrim, "Graph Databases, 2nd Edition", O'Reilly Media, Inc., 2015, https://learning.oreilly.com/library/view/graph-databases-2nd/9781491930885/.
Object Management Group, "OMG Systems Modeling Language™ (SysML®), Version 2.0 Beta, Part 1: Language Specification", 2023, https://www.omg.org/spec/SysML/2.0/Beta1/Language/PDF.